-
 contact@diggers-consulting.com
  01 73 28 29 65
 LinkedIn

Overview
Splunk and the ELK Stack use two different approaches to solve the same problem. People typically choose one over the other based on how their organizations are structured and how much time they intend to devote for log & data analytics. Splunk takes a pile of data and allows people to extract useful information from it. ELK requires more work and planning in the beginning, but the value extraction is easier at the end.
Both Splunk and the ELK Stack can be used to monitor and analyze infrastructure in IT operations as well as for application monitoring, security and business intelligence.
There are several tools available in the market that enable efficient machine data processing and storing, but how can entities identify the right tool that suits their business requirement?
The goal of this article is to provide a benchmark between Splunk and ELK stack.
Basic Architecture
SPLUNK :
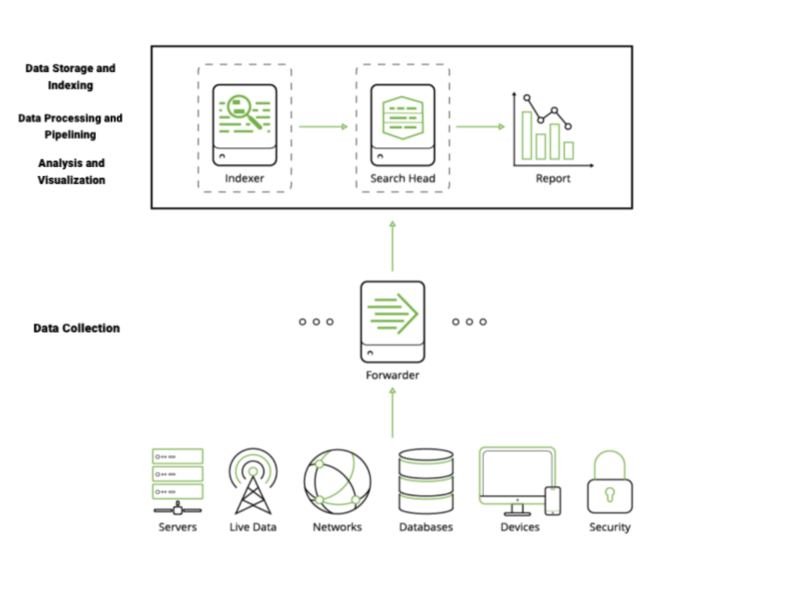
- Splunk Forwarder : The forwarder is an agent deployed on IT systems, which collects logs and sends them to the indexer.
- Splunk Indexer : The indexer transforms data into events , stores it to disk and adds it to an index, enabling searchability. It also performs generic event processing on log data, such as applying timestamp and adding source, and can also execute user-defined transformation actions to extract specific information or apply special rules, such as filtering unwanted events.
- Splunk Search Head : The search head provides the UI users can use to interact with Splunk. It allows users to search and query Splunk data, and interfaces with indexers to gain access to the specific data they request.
ELK :
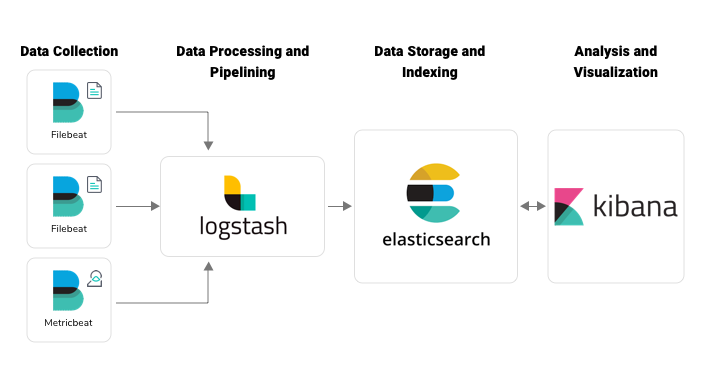
- Beats: is a data shipper which collects the data at the client and ship it either to elasticsearch or logstash (new feature)
- Logstash: (Log collection engine) Collect Logs and events data, parse and Transform
- ElasticSearch: (Database) Store, Search and Analyze
- Kibana: (VI tool) Explore, Visualize and Share, eliminating the need for complex SQL query execution
Data visualization
Both Splunk and ELK include a dashboard-type interface with visualizations of aggregated data.
SPLUNK :
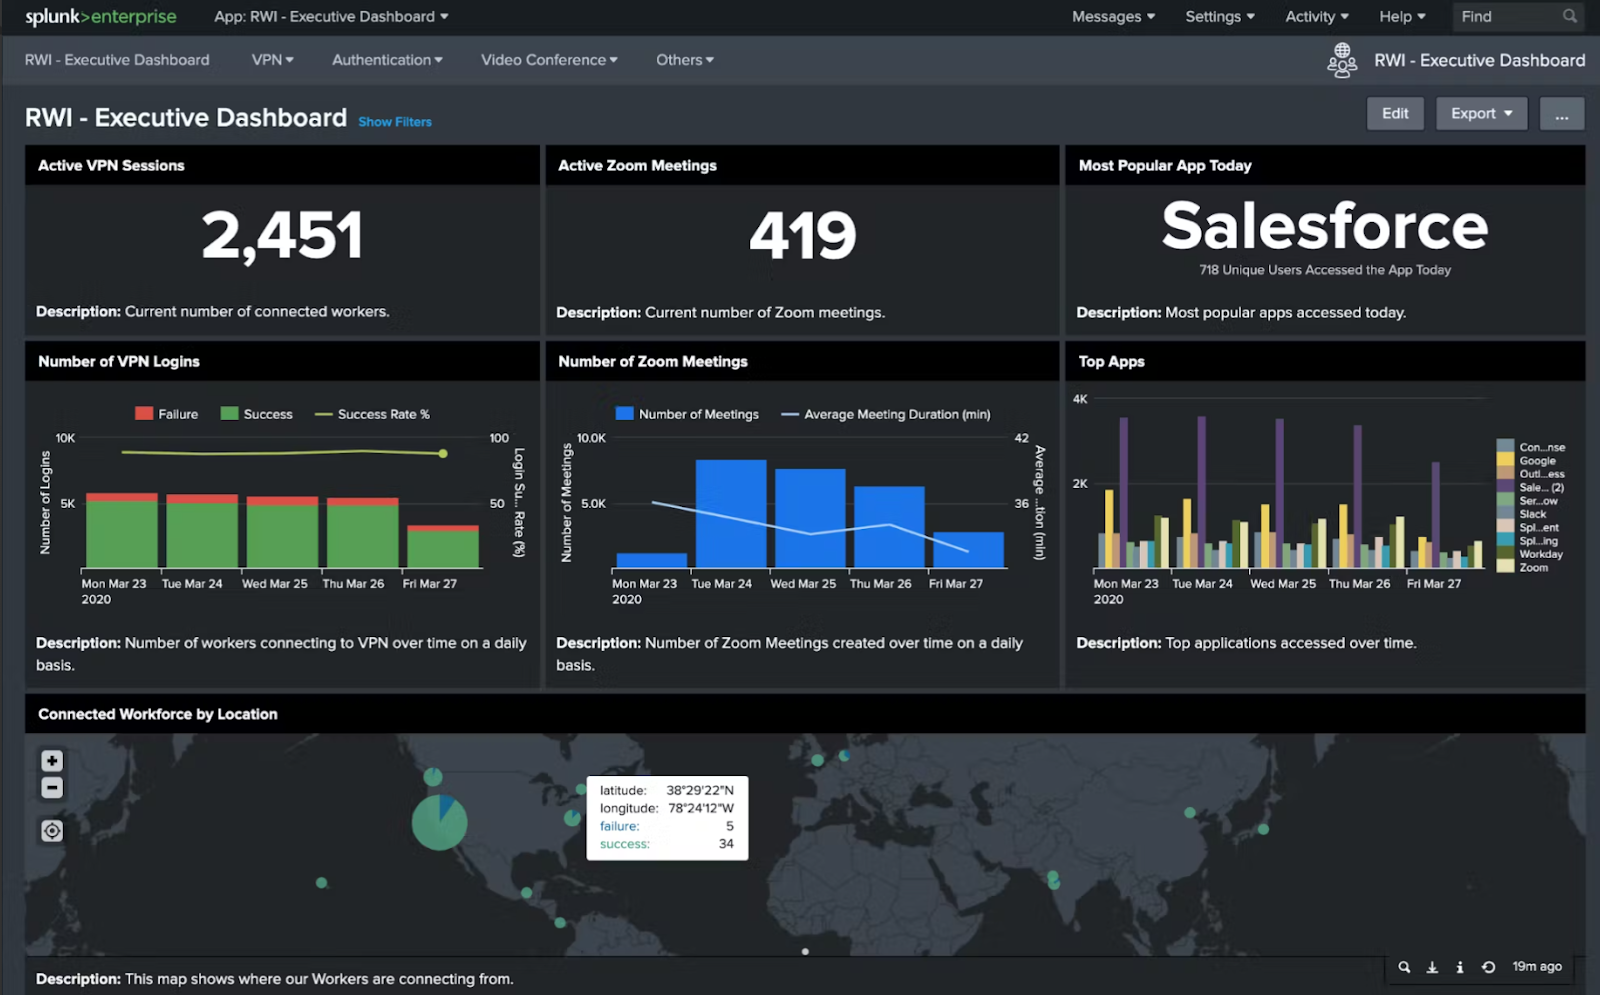
The Splunk web user interface includes flexible controls that enable users to add and edit dashboard components. Each user has access to a different customizable dashboard.
Management and user controls can be configured differently for multiple users, each having a customized dashboard. Splunk also supports visualizations on mobile devices with application and visualization components easy to customize using XML. It also has the option of exporting their dashboard to PDF.
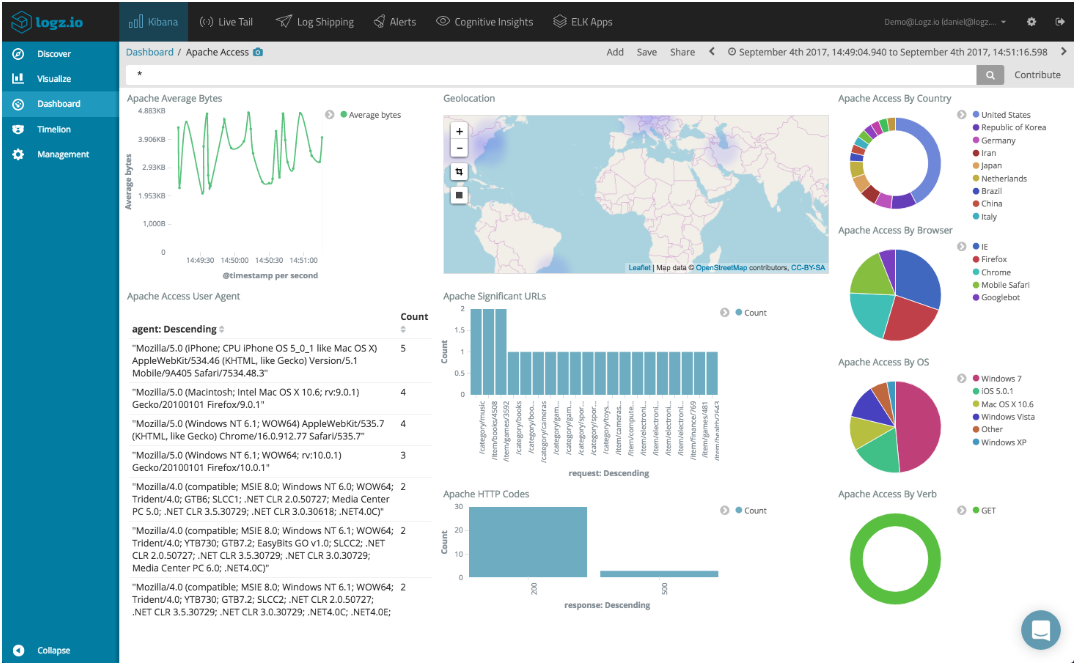
ELK :
Kibana is the visualization tool in the ELK Stack, and similar to Splunk, the platform supports the creation of visualizations such as line charts, area arts and tables and the presentation of them in a dashboard. The search filter is always shown above the different views: If a query is used, it is automatically applied on elements of the dashboard. Splunk also has a similar option, however it involves configuration in XML. Note that Kibana does not support user management, but hosted ELK solutions provide it out of the box.
Searching
Both Splunk and Kibana have a dedicated search field at the top of the web UI. Users of both tools need to learn the scripting languages required to perform in-depth searches.
Splunk offers dynamic data exploration to help users find and extract objects as searchable fields when formatted as to allow searching for non-configured fields. Elasticsearch fields, on the other hand, need to be defined in advance to use aggregation over the log properties.
Here is one example of a query for each platform.
KIBANA:
(beat.hostname: ES1 AND metricset.name: process) AND (system.process.username: root OR system.process.username: admin)
SPLUNK:
(index=* OR index=_*) (index=_audit) | search ( action=search NOT dmauditsearch ) « 06:54 »
User Management
The ELK Stack provides role-based security as a separate paid tool. However, Splunk has this feature included.
Comparison Table
| FEATURES | SPLUNK | ELK |
| Components | Forwarder, indexer, and search head (one single installation) | Logstash OR Beats , Elasticsearch, and Kibana (each component is an independent installation) |
| Cost | 15 days free trial It depends on the volume indexed daily i.e. how much log data sent to splunk to process/store. Splunk is free to download and use if daily indexing volume does not exceed 500MB | Open source + payment required for some features like user management, security, alertings, scheduling, reporting clustering, … |
| Data collection | Universal Forwarder + db_connect (SQL explorer) | Beats OR logstash |
| Data parsing | Does event parsing once searches are executed: Sourcetype | Does event parsing once data is ingested : Ingest pipeline |
| Searching | SPL : Search Processing Language | KQL (Kibana Query Language) Lucene search engine |
| Visualization | Integrated in the UI | Kibana |
| Data Format | Splunk accepts data in any format – JSON, CSV, any log file | Elk does not support all data types, plugins are necessary |
| User management | Integrated in splunk | Paid solution. Unable to manage the users that will modify or observe dashboards and data. |
| Alerting (email, pagerduty, google chat, slak …) | Integrated in splunk (configured from the UI) | Paid solution |
| Scheduling | Integrated in splunk (configured from the UI) | Paid solution |
| Reporting | Integrated in splunk (configured from the UI) | Paid solution |
USE CASE : Log Collection from servers
ELK
On agent side :
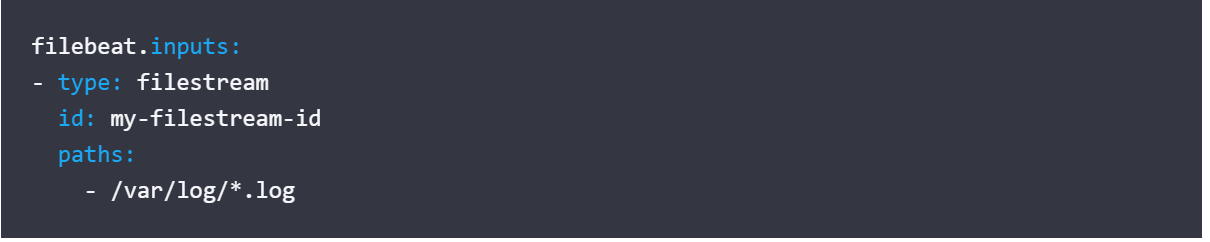
- Install the agent and set the configuration
- Specify the input to monitor
- Set basic authentication :
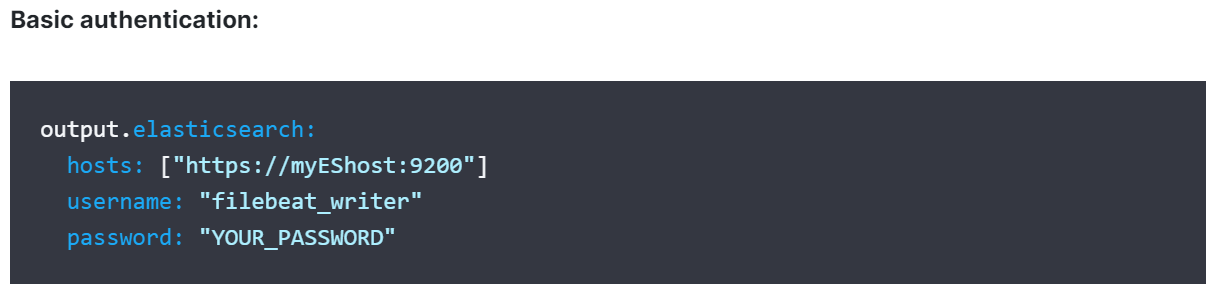
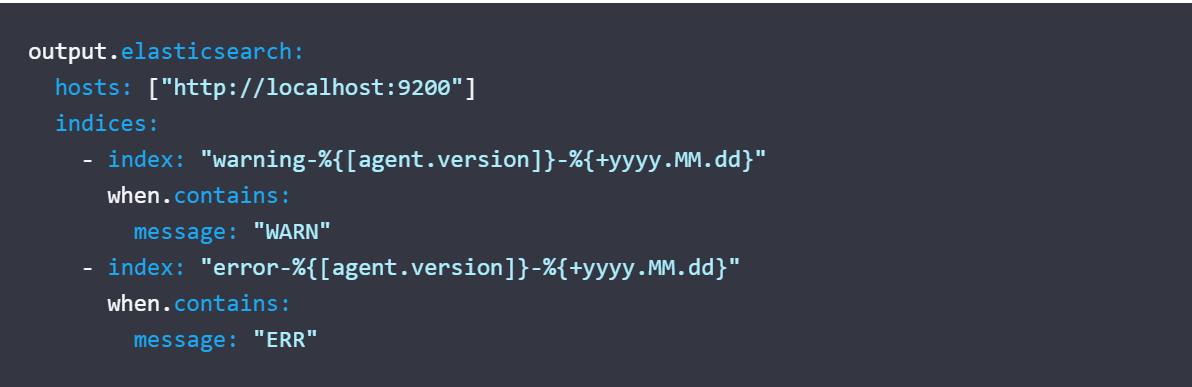
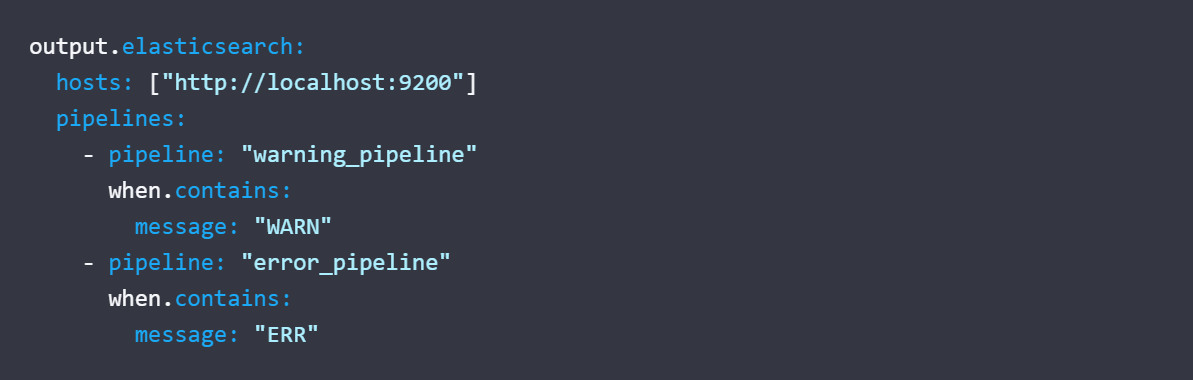
- Set the index name and the ingest pipelines (with the appropriate condition if the system requires it based on data type)
On Elastic side :
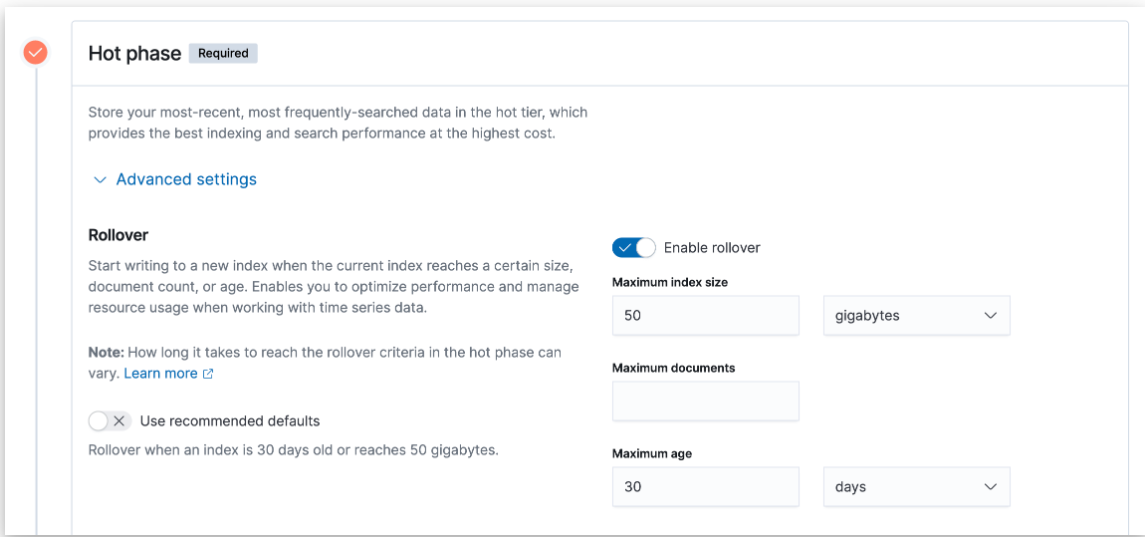
- Define the index, set the index template with defining the lifecycle and the ingest pipeline :

- Configure them from the UI: Lifecycle policy : size, age , …
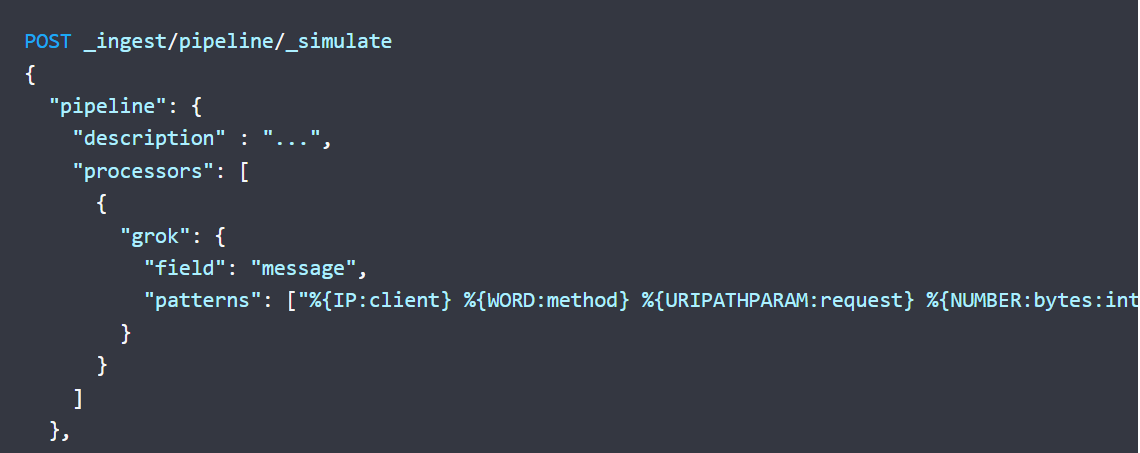
- Ingest pipeline : grok, drop, set, script, remove…
Now find the defined data in elastic, analyze them and build dashboards and visualizations from KIBANA.
SPLUNK
On agent side :
- Install Universal Forwarder (UF) on the agent.
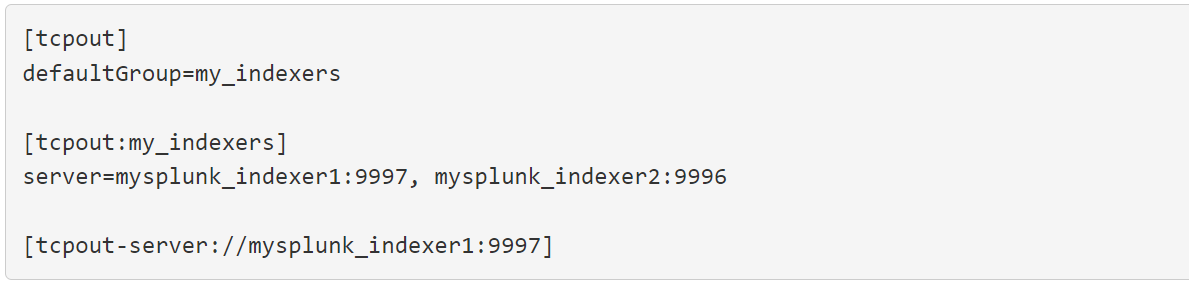
- Enable forwarding on the host and specify a destination
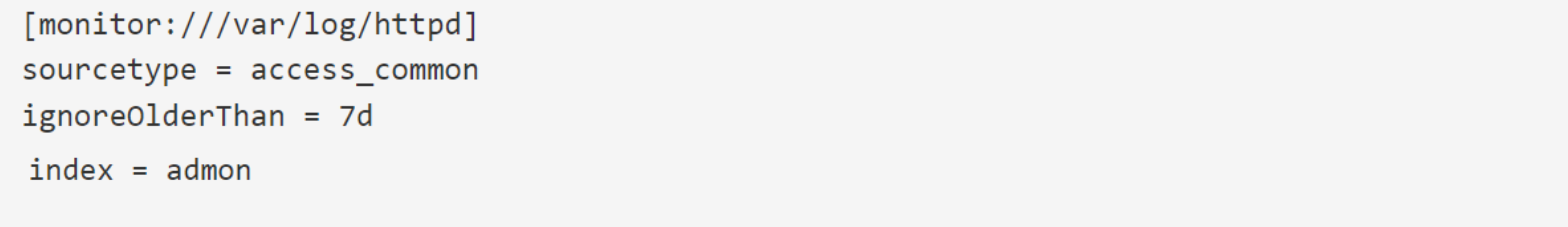
- Configure inputs for the data to collect from the host : define the index and the sourcetype.
outputs.conf
inputs.conf :
On Splunk side :
- Configure a Splunk Enterprise host to receive the data.
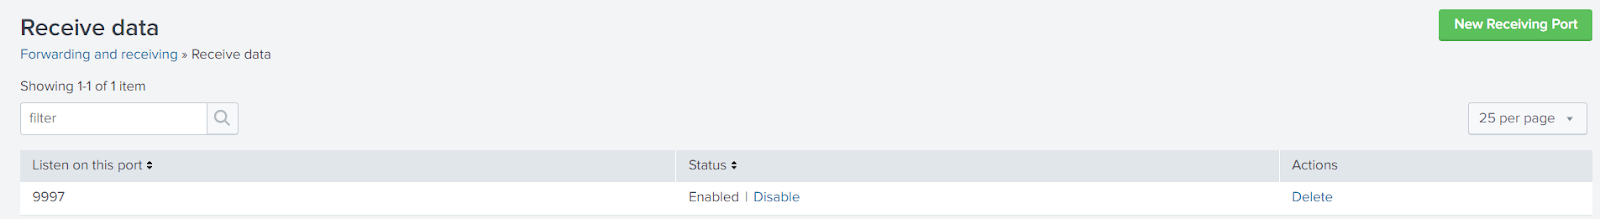
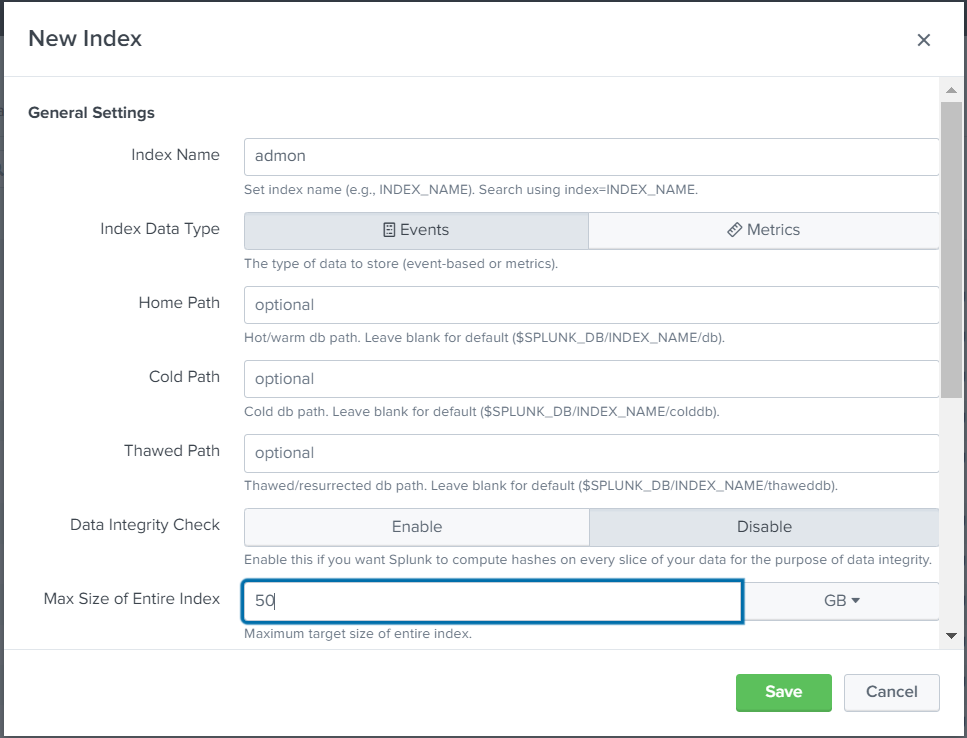
- Set the Index from the UI
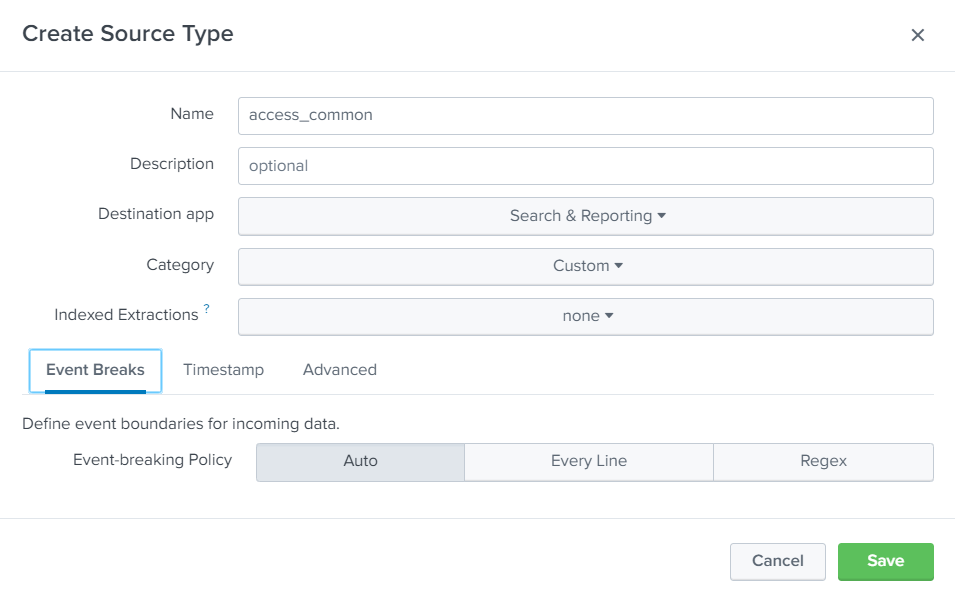
- Configure the sourcetype from the UI : here you can add the rules to properly extract data : event-breaking policy, charset, delimiter, regex field extraction, …
Now find the defined data in Splunk, analyze them and build dashboards and visualizations.
Conclusion
Comparing Elastic and Splunk is an interesting task. Overall, Splunk and Elk both are meant for monitoring, analyzing, aggregating, and visualizing a variety of machine log files. However, both of these tools have their own set of pros and cons.
Based on organizational requirements, client needs, budget, timelines, resources, and infrastructure, stakeholders will have to finalize which one to choose from. It would be recommended that if the organization is small or medium-sized, Elk can be more convenient; else as for large enterprises, Splunk is recommended.
Credit: Photo de Myriam Jessier sur Unsplash
| Article précédent | Article suivant |